Skip to content
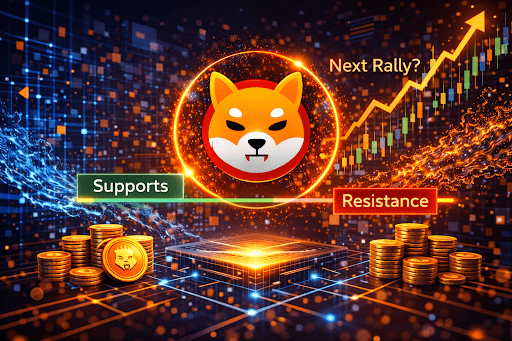
Shiba Inu trades at $0.00000474 with a $2.79 billion market cap after a steady multi-week grind lower. The token has now lost the $0.00000510 support that held for most of April and May, opening up the question every short-term trader is asking: which levels actually trigger a rally from here, and which are noise? The honest answer involves Fibonacci extensions, Bollinger Band compression, and one critical macro catalyst arriving June 10. None of this involves “to the moon” speculation. It involves specific price levels with specific behavioral implications.
The Current Setup: Oversold but Not Capitulated
The most important read on SHIB right now is the gap between oversold technicals and the lack of capitulation selling. Daily RSI sits at 34.22 — firmly in oversold territory but well above the sub-20 readings that mark true capitulation events. Translation: traders are unhappy, but no one is panicking. That distinction matters because rallies that begin from capitulation lows look very different from rallies that begin from controlled accumulation lows. The current state is closer to the second category.
Bollinger Band Width has compressed to 0.18, which is among the tightest readings of 2026. Compressed bands measure volatility, not direction. They tell you a meaningful move is coming. They do not tell you which way. As a result, the current setup is best understood as a coiled spring without a known direction, where the trigger levels determine the outcome rather than the underlying tape.
The MACD histogram remains in negative territory but the slope has flattened over recent sessions. By contrast, the prior multi-week decline showed accelerating negative momentum. Flattening MACD during oversold RSI is a constructive combination if — and only if — it gets confirmed by price action above key trigger levels. Without that confirmation, it is just two indicators agreeing about nothing.
The Three Levels That Actually Matter
Vague references to “key resistance” are useless without exact figures. The specific levels that will determine whether SHIB rallies or breaks down further are these:
$0.00000478 — current price/immediate pivot. SHIB is sitting almost exactly on this level. Reclaiming and holding above $0.00000478 on a closing basis is the minimum required to even discuss a rally. Failure to hold here on any meaningful retest indicates sellers remain in control.
$0.00000510 — first rally trigger. This is the level SHIB lost during the recent breakdown, which means it now acts as resistance instead of support. The classical technical analysis principle is that broken support becomes resistance — and proving that resistance has actually flipped requires a sustained daily close above this level with above-average volume. Without that, any move into this zone is a retest, not a breakout.
$0.00000625 — confirmation level. This is the level that distinguishes a relief bounce from a structural reversal. The $0.00000600-$0.00000625 zone has been the consistent supply ceiling for months, with multiple rejections proving it acts as real resistance rather than psychological barrier. A clean daily close above $0.00000625 with volume exceeding the 20-day average by at least 40% would be the first technical signal that the medium-term trend has reversed.
Below current price, the levels that matter most are $0.00000465 (immediate support tied to the rising 0.236 Fibonacci level), $0.00000450 (psychological floor and prior consolidation zone), and $0.00000420 (the level where algorithmic selling would likely accelerate). Loss of $0.00000420 invalidates the entire rally thesis and opens up a path toward $0.00000380.
The Fibonacci Framework Adds Precision
Fibonacci retracements from SHIB’s January 2026 high of approximately $0.00001650 down to the recent low produce specific resistance levels for any rally attempt. The 0.236 retracement sits near $0.00000680, the 0.382 sits near $0.00000840, and the 0.500 sits near $0.00000940. Therefore, even in a strong rally scenario, the first major resistance after clearing $0.00000625 is $0.00000680. The $0.00000800-$0.00000850 zone caps the immediate upside potential of any short-term move.
None of these levels represents a return toward the $0.00001650 January high, let alone the all-time high of $0.00008616. Short-term rally analysis operates on different timeframes than long-term price prediction. A 30-40% move from current levels would be a substantial rally for short-term positioning even though it would not change the longer-term picture.
The June 10 Catalyst That Most Analysts Are Ignoring
The macro context matters more than most SHIB-focused analysis acknowledges. The June 10 US CPI release is the single biggest near-term catalyst for crypto, including SHIB. A softer-than-expected CPI print would likely trigger broad risk-on flows across crypto markets, which historically pulls altcoins like SHIB higher regardless of individual project fundamentals. By contrast, a hot CPI print would extend the current risk-off rotation and likely send SHIB toward the $0.00000420-$0.00000450 zone.
This dependency on macro conditions is uncomfortable for SHIB-only analysts who prefer to discuss ecosystem developments. However, ignoring it produces incomplete analysis. SHIB has historically traded as a high-beta risk asset, which means it amplifies broader crypto market moves. Consequently, the next directional move is likely to be determined as much by macro positioning around the CPI release as by SHIB-specific signals.
Traders watching only SHIB technical indicators will miss the actual trigger. Those watching Bitcoin’s behavior around $60,000-$62,000 alongside SHIB’s $0.00000478 level will get a much clearer read on which scenario is playing out.
Analyst Perspective
“The most consistent mistake retail traders make at oversold extremes is confusing the absence of panic with the presence of strength,” noted Carl Eric Martin, also known as TechDev, in commentary on cycle position analysis. “An asset that has stopped falling has not necessarily started rising. The signal you need is volume expansion through resistance, not just the absence of further weakness. Without that confirmation, oversold conditions can persist for weeks before resolving.”
That observation applies cleanly to SHIB’s current setup. RSI at 34 and compressed Bollinger Bands are necessary conditions for a rally but not sufficient ones. The sufficient condition is volume expansion on the move above $0.00000510 first, then $0.00000625. Without that volume confirmation, the oversold readings could persist while price drifts lower or sideways for another two to four weeks.
Scenario Probabilities
Three distinct scenarios deserve quantification for traders positioning around the next directional move.
Scenario one (probability: 45%). SHIB holds above $0.00000465, reclaims $0.00000510 on a daily close, and pushes toward $0.00000600-$0.00000625 over 7-14 days. Whether this resolves into a real breakout depends on volume at the $0.00000625 retest. Most likely outcome under this scenario: a sharp 15-25% bounce that then runs into resistance and consolidates.
Scenario two (probability: 30%). SHIB grinds sideways between $0.00000465 and $0.00000510 for another 1-3 weeks, with both bulls and bears unable to force a directional move. This scenario produces little net price action but allows volatility to compress further before the eventual break. Compressed Bollinger Bands typically resolve within 3-5 weeks of reaching readings as tight as the current 0.18.
Scenario three (probability: 25%). SHIB loses $0.00000465, accelerates lower through $0.00000420, and tests $0.00000380. This scenario most likely follows a hot CPI print or a Bitcoin breakdown below $60,000. The downside target zone of $0.00000380 represents another 20% decline from current levels.
These probability estimates are not guarantees. They are weighted scenarios based on current technical structure, macro context, and historical analog behavior. Position sizing should reflect the probability distribution rather than assume any single scenario will deliver.
The On-Chain Picture
Technical setups gain or lose credibility based on on-chain data, and SHIB’s on-chain signals are quietly constructive even as the price chart looks ugly. Exchange reserves continue declining, suggesting accumulation rather than distribution. Active addresses have grown steadily through April and May. Long-term holder dormancy remains elevated, meaning the patient capital is not selling into weakness.
By contrast, short-term holder behavior shows continued selling pressure from positions established between $0.00000600 and $0.00000700 over the past several months. As a result, the market is undergoing a transfer from short-term holders capitulating to long-term holders accumulating — a classic late-stage decline pattern that typically precedes either a sharp reversal or an extended grinding bottom.
The 800 billion SHIB sell by an OG whale earlier this month complicated the picture but did not invalidate it. The whale still holds a substantial position, indicating gradual distribution rather than a full exit. Therefore, his selling represents supply overhang rather than panic capitulation.
What Disciplined Positioning Looks Like
Traders looking to position around the next directional move face an asymmetric setup that favors patience. The cost of waiting for confirmation above $0.00000510 with volume is small. The cost of being wrong on a premature entry while $0.00000465 fails is significant. As a result, the rational approach is to define explicit triggers and stops rather than guessing direction.
Practical implications: long positions only make sense above a confirmed daily close at $0.00000510 with a stop below $0.00000465. Short positions require a confirmed daily close below $0.00000465 with a stop above $0.00000485. Anything between these levels is consolidation noise that does not justify position entry in either direction.
Verdict
SHIB has the technical setup of an oversold asset that has stopped falling without confirming it has started rising. RSI at 34, Bollinger Bands compressed to 0.18, flattening MACD, and constructive on-chain signals all point toward potential reversal conditions. However, the trigger levels at $0.00000510 and $0.00000625 have not been cleared, and the June 10 CPI release represents a near-term macro catalyst that will likely determine the next move more than any SHIB-specific signal. Position around the trigger levels, not around hope. Watch volume on any move above $0.00000510 as the most important short-term signal. Without volume confirmation, treat the current setup as continued consolidation rather than imminent rally.
FAQ
What is the most important SHIB level to watch right now?
$0.00000510 is the first rally trigger — broken support that now acts as resistance. A daily close above this level with volume would signal the immediate downtrend is pausing. Without it, any bounce is a relief bounce rather than a structural reversal.
What would trigger a SHIB rally to $0.0000080?
A confirmed break above $0.00000625 with volume expansion of at least 40% over the 20-day average, combined with supportive macro conditions (softer CPI print, Bitcoin holding above $62,000). Both conditions together produce the highest probability path to the $0.0000068-$0.0000084 Fibonacci resistance zone.
Does the June 10 CPI release matter for SHIB?
Yes, significantly. SHIB trades as a high-beta risk asset that amplifies broader crypto market moves. A softer-than-expected CPI typically triggers risk-on flows across altcoins. A hot CPI extends current risk-off conditions. The macro context matters more than most SHIB-only analysis acknowledges.
Is SHIB oversold enough to bounce?
RSI at 34.22 indicates oversold conditions, but oversold and reversing are not the same thing. Oversold assets can remain oversold for weeks before resolving. The bounce needs volume confirmation above $0.00000510 to be considered structural rather than mechanical.
What would invalidate the rally thesis entirely?
A daily close below $0.00000465 with above-average volume invalidates the immediate rally setup and opens up downside toward $0.00000420 and then $0.00000380. Loss of $0.00000420 confirms the bearish scenario is materializing.
About the Author
Marcus Chen is Senior Crypto Analyst at Shiba Inu Price Prediction, covering memecoin markets, Layer 2 ecosystems, and on-chain analytics. He has tracked the SHIB ecosystem since 2021 and writes weekly technical and fundamental breakdowns for retail and institutional readers.
Disclaimer
This article is for informational and educational purposes only. It does not constitute financial, investment, or trading advice. Cryptocurrency markets are highly volatile and you can lose your entire investment. Always conduct your own research and consult a licensed financial advisor before making any investment decisions.